dubizzle
My role: Product manager
Goal: Creating a category tree for the most diverse country in the world
Creating a category tree for the most diverse country in the world
dubizzle’s classified vertical does not currently make money, as opposed to the real estate and motors verticals. However, the classified (goods) vertical has a strong “network effect.” This means that this vertical is a gateway for users to use other revenue-making verticals. Therefore, the business needs were to increase important KPI’s in the classified section so that other verticals would make money. The KPI’s that were targeted were intended to :
1. Make Sellers Happy
In the chicken and egg problem associated with two-sided marketplaces, the supply side is usually harder to attain. This was also the case for dubizzle. For that reason, it was important to make the supply side happy so that they would be returning users.
2. Target Untapped Markets
Certain categories could have a lot more liquidity if executed correctly. For example, it’s possible strollers would have a lot interaction if it was clear that there is a lot of inventory in these categories. By attacking these categories with high potential, there could be hockey stick growth, as a “flywheel” could start to ramp up.
3. Improve Search and Discoverability
Improving search and discoverability would mean that users are able to find the products they are looking for. The category tree is confusing for users to navigate through, and they often will stop looking for products simply because they couldn’t find it, although the product may actually be there.
User Research
The first step revamping the category tree was to make sure that all information was in front of us before going into solution-mode.
Interviews
- Broad user interviews allowed me to see what kind of items they would be interested in.
- Stakeholders had a lot of the data that I would have sought out. For example, they were able to tell me that 80% of users were male, and over 90% were expats.
- Stakeholders made the problem statement clear
- Stakeholders had a lot of information already
- Partner OLX companies gave me guidance on when the search bar is important and when navigation is important.
Data Analysis
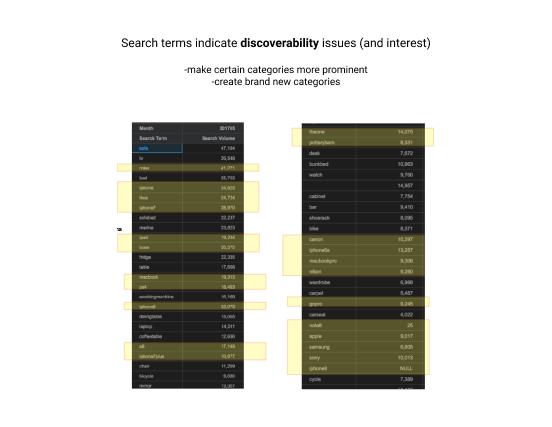
- I looked at highest amount of search keywords
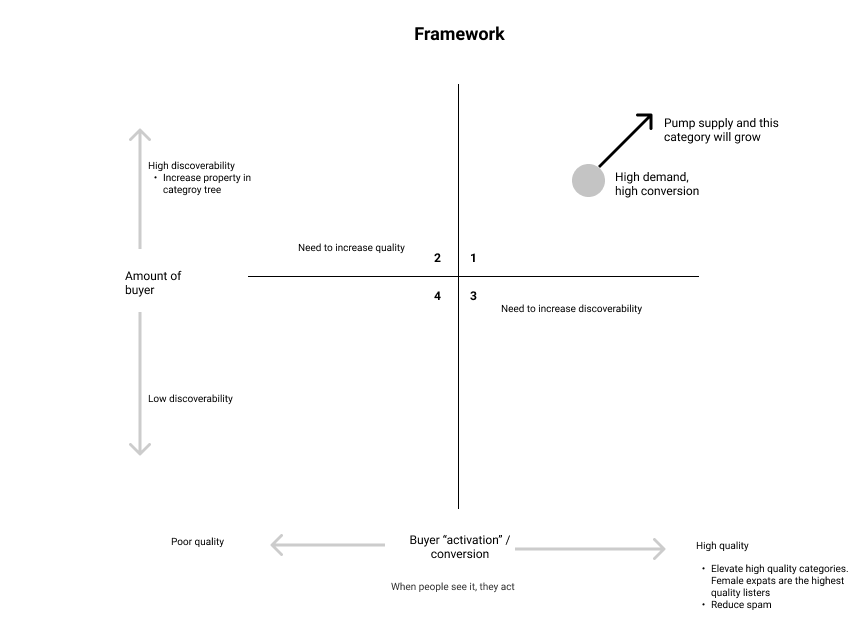
- I looked at supply-demand balance, and overall volume of product in categories
- I looked at seller profiles, and how there were small vendors and entrepreneurs who skewed a lot of the data I was seeing.
- I had an intensive look at all of the data about the classified section.
Card Sorting & Tree Testing
- Card sorting was used both before and after creating the new category tree.
- Doing it beforehand allowed me to have a look at key areas for improvement.
- Doing it afterwards allowed me to see if the solutions we made were being effective or not.
- One issue I discovered in my research method was I printed out too many categories, and cut them them too small, for me to do card sorting. For example, just breathing hard would blow the cards all over the place.
- Workflowy is a great way to test on the computer to get similar information, and it can be done quicker and at scale. UserZoom is a more official tool for doing tree testing, but workflowy was free and sufficient.
User Testing
- I was not actually given resources to do proper user testing. For that reason, I bribed friends to do user testing with me and sat in the office’s kitchen asking for a moment of time from coworkers. I used Lookback to record the testing.
- User testing not only tested taxonomy, but also tested how the interface influences the category tree. In the end, this was useful because it showed when users were tempted to simply use the search bar. It was also useful because users were able to go through and see the products once they .
- Sometimes, I was able to see that a category should be split apart, or a two categories should be put together because of the way users blended types of products in their mind. For example, users may want to see office furniture and tables at the same time.
6 Key Factors I Looked at to Make Decisions about the Category Tree
With all of the information gained through research, I was able to put the findings to use through these tactics
1. Liquidity, volume, supply & demand
- We prioritize looking at categories with highest volume (electronics and furniture)
- Second, we focus on making sellers happy so that they become returning sellers. So we look at categories that have over-supply (furniture), and don’t hierarchically emphasize categories that have over-demand (electronics).
- Making this decision of what categories are important will be reflected in the category tree when trade offs need to be made about what becomes a top level category
2. Network Effect
Some categories have more important and higher network effects than others.
- People who buy nice watches are the some people who buy nice cars.
- It’s important to bring in buyers who will buy nice cars, since this luxury cars is a high-revenue making vertical/category
- Therefore, nice watches should be prioritized in the category tree

3. Potential market opportunities
Market opportunities could be discovered several different ways.
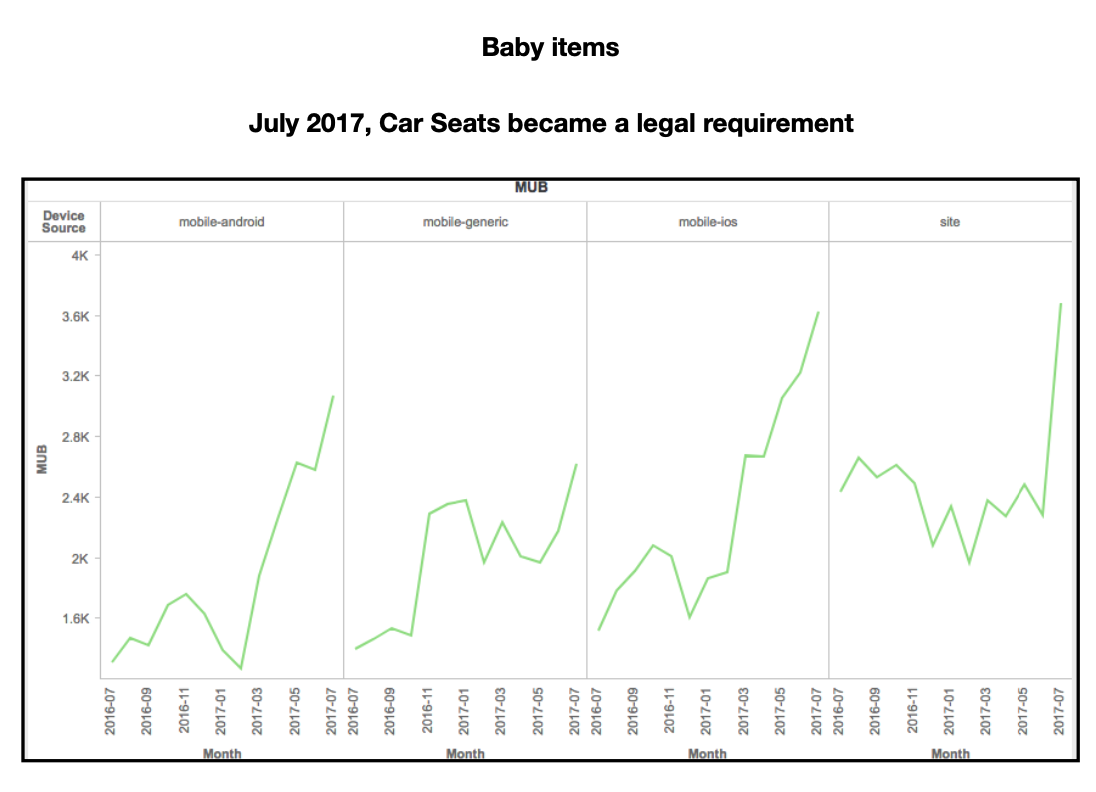
- One important way is to see if demand is increasing steadily in the metrics. If it is, it means that dubizzle might want to make this category more obvious to users, since they seem to be looking for it more and more.
- Example: Car seats had become mandatory in the UAE in 2017, and there was an increase in demand within dubizzle. dubizzle could capitalize on that by elevating the car seat category

4. Top to Bottom Reading
- After doing research, I saw that users would frequently choose the wrong categories because they saw a relatively similar, but incorrect, category first.
- Example – if given a task to find phones – users would click electronics because they saw it first
- Example – if given a task to find a refrigerator, users may click furniture, home and garden before seeing home appliances
- I strategized order based around this sort of logic: X can be confused with Y, but Y cannot be confused with X

5. Serendipity
- Sometimes, categories should be eliminated even though they could be distinct and discoverable
- This is in the cases that a “jobs to be done” use case has been discovered
- Example – When doing research I found that users may have a certain style of table in mind (e.g. black desk), but when they stumbled across another type of table (e.g. glass dinner table) they would be willing to inquire about it.
- This means that liquidity will increase even though users would have thought they wanted categories split apart.
- To illustrate the opposite – users only care about shoes that are their size. Currently, in dubizzle, one cannot filter by their shoe size, which makes this category too laborious.
6. Use of Icons
- First, 90% of our users came from different cultural backgrounds, so icons were a valuable tactic to transcend language and cultural barriers.
- Example – it is much easier to see what each category means when looking at olx poland, even though you probably don’t speak Polish
- Second, some sub-categories (level 2 or 3) are incredibly important – discovered from the data analysis. Icons are a good way to make it even more salient that these sub-categories exist under a higher category.
- Example – couches are very important to display, and so they be the icon chosen for the top level.
Final Top Level Categories
After taking in all of the factors, I came up with this. To finally implement this, many A/B tests had to be done. First, dubizzle has millions of users who are used to using the product, so the tree can’t be completely changed on them at one time. Second, many of these solutions are mere hypotheses, and assumptions must be validated. However, in the end, this is what the strategy was:
